Highlights of the BPS User Experience and Workflow
Introduction
Effective productivity tools are easy to use and generate a natural workflow. BPS is designed to increase the productivity of researchers who wrestle with “who, what and when” to identify persons in order to turn to larger, and more interesting, questions of “how” and “why.” Here, in narrative and illustration, we provide an introduction to the BPS user experience as implemented, or as planned. Nearly all the figures are drawn from the results of processing the BPS demonstrator corpus, the legal cuneiform texts from the Hellenistic period (331-46 BCE) in Mesopotamia (ancient Iraq), available at Hellenistic Babylonia: Texts, Images and Names (HBTIN). These clay tablets, into which scribe impressed the wedge-shaped characters of the cuneiform script, thus preserved details of legal transactions—sales of real estate, slaves, shares in income from temple offices, and divisions of inheritance—as well as the names of participants in a particularly Babylonian formula: PN (personal name) son of PN2, son of PN3, descendant of Ancestor’s Name. Thus, each name instance identifies two, three, or even four additional family members, who may or may not appear in other activities and contexts elsewhere in the archive. Another naming practice employed in this corpus, papponymy (naming a child for a grandfather), results in many grandfathers and grandsons having the same personal name, and adds to the problem of disambiguation of name sakes. The complexities of disambiguation and the effect it may have on research outcomes are addressed in the Research Problem and presentation of the BPS User Experience that follow.
Figures
- Figure A - Hand-written Family Tree
- Figure B - Printed Diagram of Network Relations, Ossendrijver
- Figure C - BPS Architecture Diagram
- Figure D - WYSIWYM TEI Editor
- Figure E - Basic display of Name Instances
- Figure F - General Settings: Setting Model Parameters
- Figure G - General Settings: Intra-document Rules
- Figure H - Assertion List
- Figure I - Workspace Dashboard
- Figure J - SNA: List of Disambiguated Persons
- Figure K - SNA: Selecting Documents
- Figure L - SNA: Selecting Activities
- Figure M - SNA: Selecting Individuals
- Figure N - Family Tree
- Figure O - Network Visualization, Single Individual
- Figure P - Radial View
Example of a Research Question: The Arc of a Scribal Career
Pearce and Doty’s study (2000) of the careers of two residents of Uruk, both named Anu-belšunu, son of Nidintu-Anu, son of Anu-uballit, descendant of Sin-leqe-unnini, established that these members of a prestigious family not only bought and sold shares in income derived from hereditary positions in temple service, but also were accomplished scribes and scholars. Pearce and Doty traced each man’s career and demonstrated that the two trajectories of scribal activities conformed to similar arcs and timelines. Early in their careers, both scribes wrote legal documents, the kinds of transactions in which they and family members participated as buyers, sellers and witnesses. With the passage of time, they moved into the circle of individuals who witnessed the transaction, and claimed ownership of scientific and scholarly tablets (astronomical tables, ritual texts, etc.), associating themselves with the intellectual and religious life of the community. Pearce and Doty’s conclusions emerged from their study of 515 contracts and the preserved colophons appended to approximately 700 scholarly texts, from which they extracted and compiled an onomasticon (list of names) and family trees for the entire corpus. Having identified 385 instances of the name Anu-belšunu in that corpus, they engaged in the oft-times messy process of manually disambiguating namesakes (see Examples of visualizations in non-digital prosopography projects, Figure A, an extract of Pearce’s handwritten notes), and ultimately identified two similarly named scribes, grandfather and grandson, active in a sub-corpus of thirty-five documents. The disambiguation process utilized attributes of persons clearly articulated in the sources (e.g., name, father’s name, date of activity), as well as some that were open to varying degrees of interpretation (e.g., for how many years an individual is active in business). Close examination of Figure A shows that manual disambiguation takes into consideration attributes considered to have high probability of identifying a particular individual, e.g. document date and professional designation of the individual as scribe. Other attributes may be considered to carry less weight in the disambiguation process, or their importance may be interpreted variously by different scholars. Although they did not employ a mathematical model, Pearce and Doty (2000:334-6) articulated the heuristics behind their disambiguations in terms of the likelihood (probability) that or degree to which any particular feature was valid.
Highlights of the BPS User Experience and Workflow
The figures and narrative are organized into three sections, Text Preprocessing, Disambiguation and Social Network Analysis (SNA), and Presentation, Visualization, Reporting, corresponding to the BPS Architecture Diagram, Figure C. Each major section contains images of the interface in the order the user generally will encounter them, reflecting an approach familiar to prosopographical researchers. Captions contextualize the image in the workflow. The generalizability of BPS is assumed throughout, but special attention is drawn to those features that require specific modification by each corpus curator. Keeping in mind that the details displayed will differ from corpus to corpus, the reader is invited to explore the images and the BPS process, using the links where desired, to access larger views on the BPS site.
Text Preprocessing
Prosopographical research begins with corpus-specific preprocessing of text (BPS Architecture Diagram, Figure C, red column). The researcher identifies names and attributes that are sufficient, necessary, or likely to identify individuals and/or activities in a document. In HBTIN texts, those (and other) attributes are marked in the TEI output of text editions prepared according to project standards. Other users have requested a means of converting data in their legacy or active databases to TEI. In collaboration with the BABylo-tec project, we are developing a TEI converter that will convert data in comma- or tab-separated field formats (CSV, TSV) into the TEI BPS ingests. This will be realized early in the implementation phase, and tested and evaluated in the grant period.
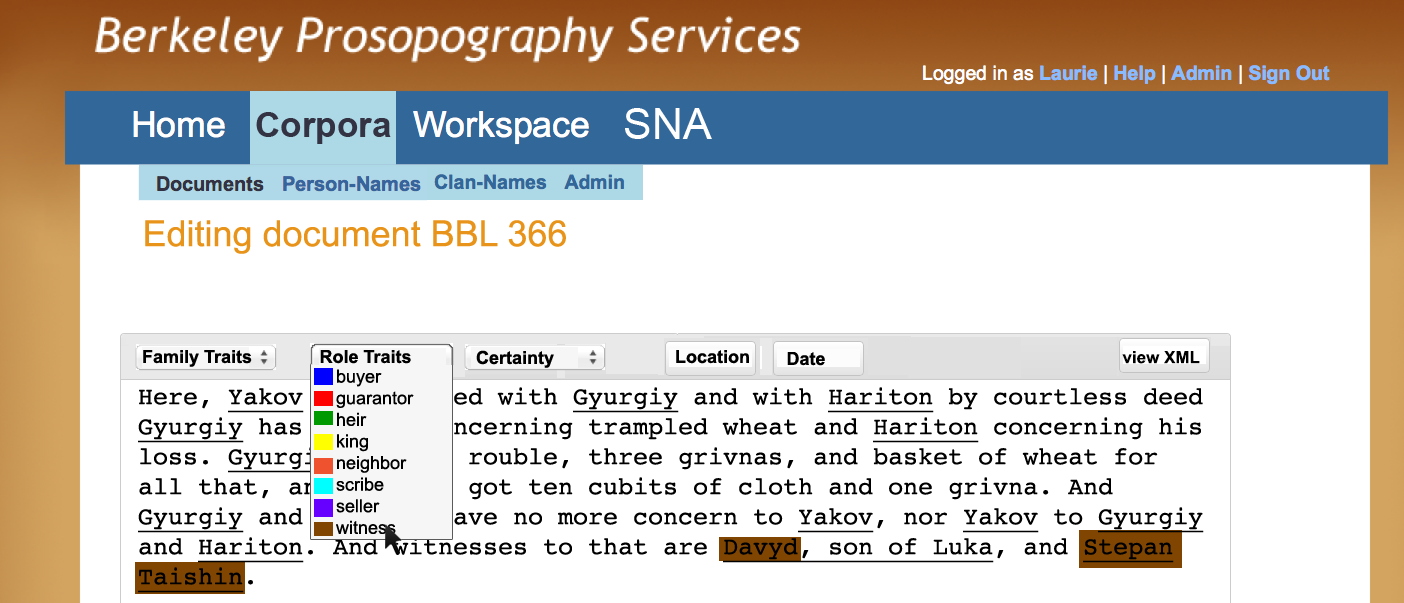
Figure D - WYSIWYM TEI Editor
Figure E - Basic display of Name Instances
Some researchers may wish to add additional TEI mark-up for persons, location, roles, and activities to existing text. To enrich the TEI, a WYSIWYM (what you see is what you mark) TEI editor may be invoked. Figure D shows how we would like this to work, although this is dependent upon identifying suitable tools for integration (we do not intend to build such an editor from scratch). Drop-down menus and color-coding would make TEI markup as easy as clicking on the desired choice. The example here is of a text in a corpus of medieval Russian letters, which does not include tags for roles within activities. Here, two witnesses are ready to be tagged.
At the conclusion of the text preprocessing stage, the user uploads the corpus marked with TEI via a simple interface in Corpora > Administration on the BPS site; in manually-driven research, pages of data, replete with many and sometimes conflicting annotations, would now confront the user.
Disambiguation and Social Network Analysis (SNA)
Once text preprocessing is complete and the corpus loaded, the system parses the input TEI, builds an internal model, and makes this available to the researcher in a workspace. The components for corpus and workspace management, disambiguation, and analysis are represented in Figure C, middle column.
Working in both the Corpora and Workspace UI sections, the researcher interacts with the data, just as Pearce and Doty considered both single documents and a group of documents within the HBTIN domain. It is in the Workspace UI that the user accesses the heart of the BPS probabilistic model. Disambiguation of namesakes in each corpus, regardless of content, depends on establishing and applying appropriate criteria (“rules”) to be applied across the corpus, as well as within texts in the corpus. Each researcher brings both specialized knowledge of corpora within a discipline and a unique perspective to the work. They combine assessments and intuitions to disambiguate namesakes, particularly when dealing with vague, incomplete, or damaged evidence. Figures E, F, and G provide an overview of how a researcher controls the probabilistic reasoning in BPS, a feature particularly useful when dealing with ambiguous, incomplete, or damaged evidence.
Figure E represents a basic display of the name instances, associated with their roles, as they appear in a particular activity. In this view the name Tanittu-Anu appears three times, twice in the role of “heir”, once in the role of “father.” The researcher must answer the question: Do these name instances represent one, two, or three distinct individuals? The person named Tanittu-Anu is the criterion that distinguishes Anu-belšunu(1) from Anu-belšunu(2). Prosopographic research depends on the disambiguation of these name instances; this view makes clear that multiple similar name instances present challenges at the initial stage of prosopographical research.
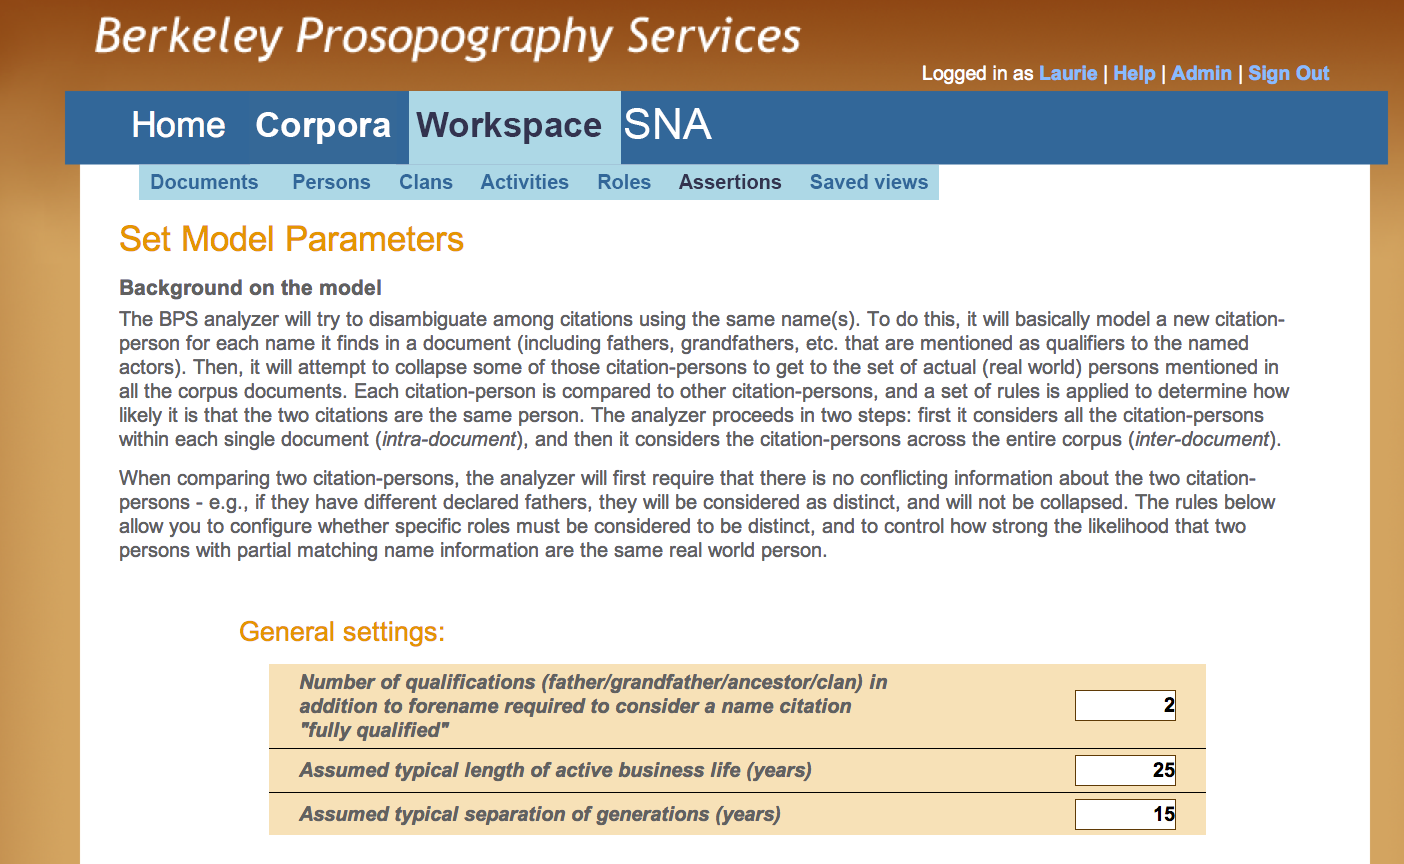
Figure F - General Settings: Setting Model Parameters
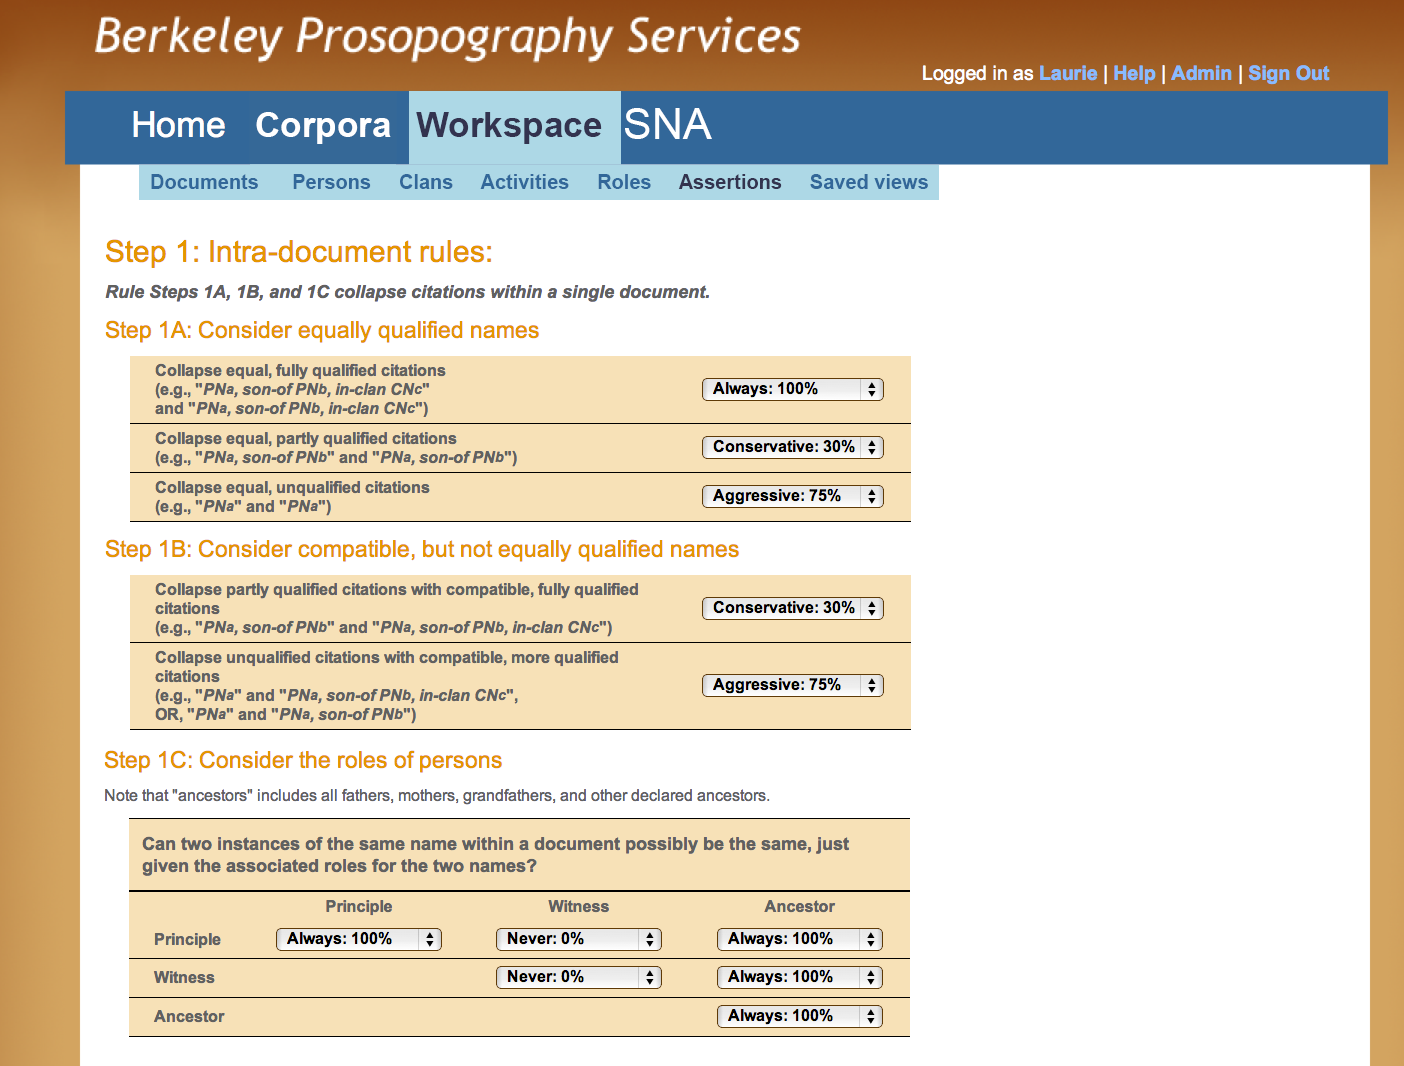
Figure G - General Settings: Intra-document Rules
A researcher begins to address this problem by asking, for example: can a “father” be an “heir”, or a “scribe” a “seller” in any given document? He will apply this and similar knowledge in various stages of setting model parameters (Figures F, G). In Figure F, the user invokes corpus-specific General Settings that reflect attributes that help define persons in the corpus as a whole. This example illustrates rules applied to the Hellenistic Uruk corpus, where a name instance such as “Anu-belšunu son of Nidintu-Anu son of Tanittu-Anu descendant of Sin-leqe-unnini”—the scribe whose career Pearce and Doty researched—occurs in multiple texts over a wide range of dates, spanning 120 years. Since this is clearly too long to plausibly refer to a single person, the corpus curator may define a "rule" for the length of a generation (or working life). Other researchers may disagree and set a different value for this variable thus increasing or decreasing the number of individuals called "Anu-belšunu son of Nindintu-Anu." When changes in the values assigned to those general settings are processed, the new output is automatically generated in the form of new disambiguation results (Figure J) and new graphs (Figures N, O, and P). Such “what if” scenarios are extremely laborious when done by hand, as illustrated by the notation “this may be earlier,” added in Pearce’s handwritten notes (Figure A); in BPS such trial-and-error requires nothing more than setting a few variables.
The general settings are configurable to implement criteria useful in other corpora: the length of active business life might well be irrelevant in a corpus of, for example, philosophical treatises produced by Muslim intellectuals; a study of the influence of an iconic zoologist in the development and spread of a research methodology may define the notion of a “generation” to cover the years from graduate student to emeritus status.
Within a workspace, the researcher sets the asserted validity (probability) of each rule, for the corpus she is working on. The settings can be shared as assertions so that other researchers can re-use them, or a subset of them, in their own research. To apply their knowledge that two individuals named Anu-belšunu, son of Nidintu-Anu, son of Anu-uballit, descendant of Sin-leqe-unnini can not serve as both a principle and witness in a single document (activity), Pearce and Doty would apply the values seen in the top row of Figure G Step 1C.
The BPS system will suggest the probabilistic association between a given name and a person (i.e., linking various names within and across documents as likely to be the same person). A researcher will review these, and then choose to accept a given result from the model, or reject that result. They may either agree or disagree completely (with 100% confidence), or they may specify a confidence level for each assertion. We describe this as making person-assertions within the system.
In addition, the researcher can choose to share a given assertion so that others can leverage their analysis in their own work on the same corpus. Figure H shows how a user will be able to review the assertions they have made, and control whether to share those or not. In a second section, they can review the assertions that they have accepted, which were shared by other researchers working in this corpus, and see who originally authored each one.
More on "What If":
The Workspace environment is a distinctive and innovative BPS feature. It enables the user to ask “what if?”— what if an individual is removed from a set of data—how does the resulting SNA change? How does this impact interpretation of the persons, activities, communities and cultural processes preserved in the text? The impact of “what if” on research outcomes research can be considered in the "Examples of visualizations in non-digital prosopography projects", Figure B, which presents the results of Ossendrijver’s analysis (Ossendrijver 2011) of networks of scribal activity in the astronomical texts in the Uruk corpus Pearce and Doty studied. The elder Anu-belšunu Pearce and Doty identified as the owner of scientific texts is one node in the single arc connecting the Sin-leqe-unnini and Ahûtu families. A researcher might ask “what if” the values that disambiguated the two Anu-belšunus were changed and "what if" the elder name instance collapsed into the younger; as a result the arc in Ossendrijver’s diagram would either move or disappear. Working manually, such a question could only be answered by re-disambiguating all persons of interest and redoing the entire graph, a process the researcher may be understandably reluctant to do. A user will be able to manage multiple workspaces, as illustrated in Figure I. It shows the interface through which users access saved explorations, view the corpora utilized, and see the rule sets applied. They can also view and control the access controls (i.e., whether it is Public or Private). Finally, they can “freeze” a workspace that represents a milestone or completed research, which is then archived for reference, attribution and citation.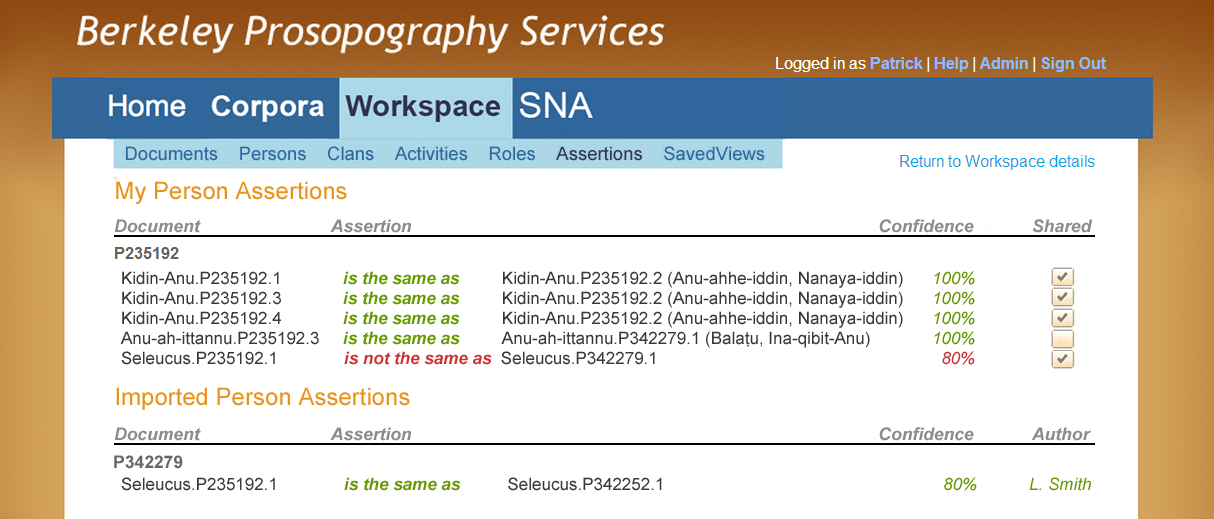
Figure H - Assertion List
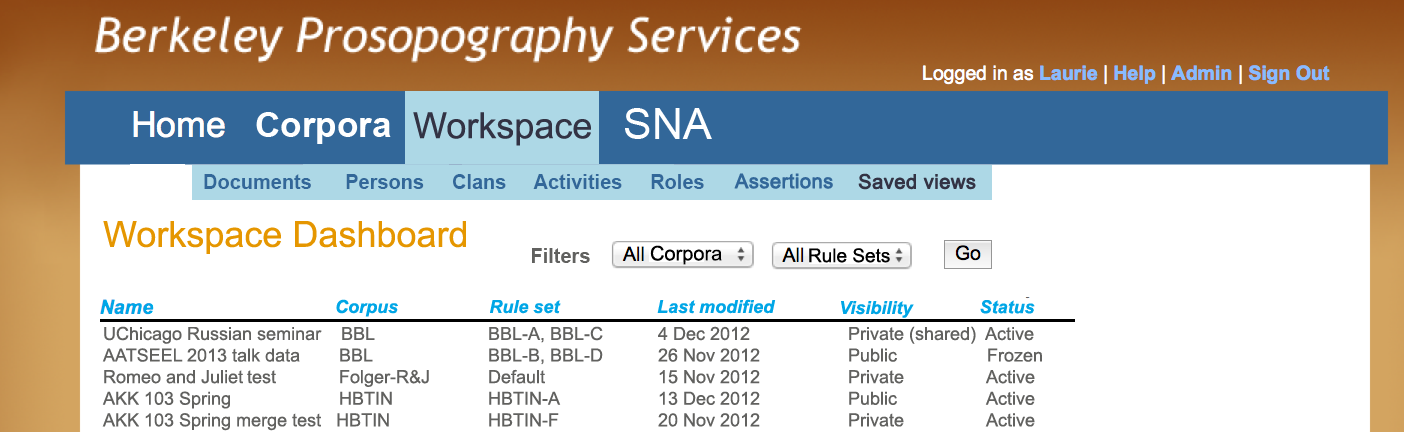
Figure I - Workspace Dashboard
Presentation, Visualization, Reporting
Discovering Names, People, Relationships:
Application of the Rules and Assertions (Figures E, F, and G, above) produces a list of the names of all individuals—the “real people” who appear in the text corpus and who populated the social environment being studied. The user can now call up the graphs and diagrams that facilitate the exploration of the lives of each individual in the corpus and the networks in which he appears.
Figure J shows a simple report: the list of disambiguated persons in the corpus. This is one starting place for the investigation of social networks. From here, the user can explore by clicking the icons to see the Family Tree (Figure M) or Social Network graphs (Figure N and O).
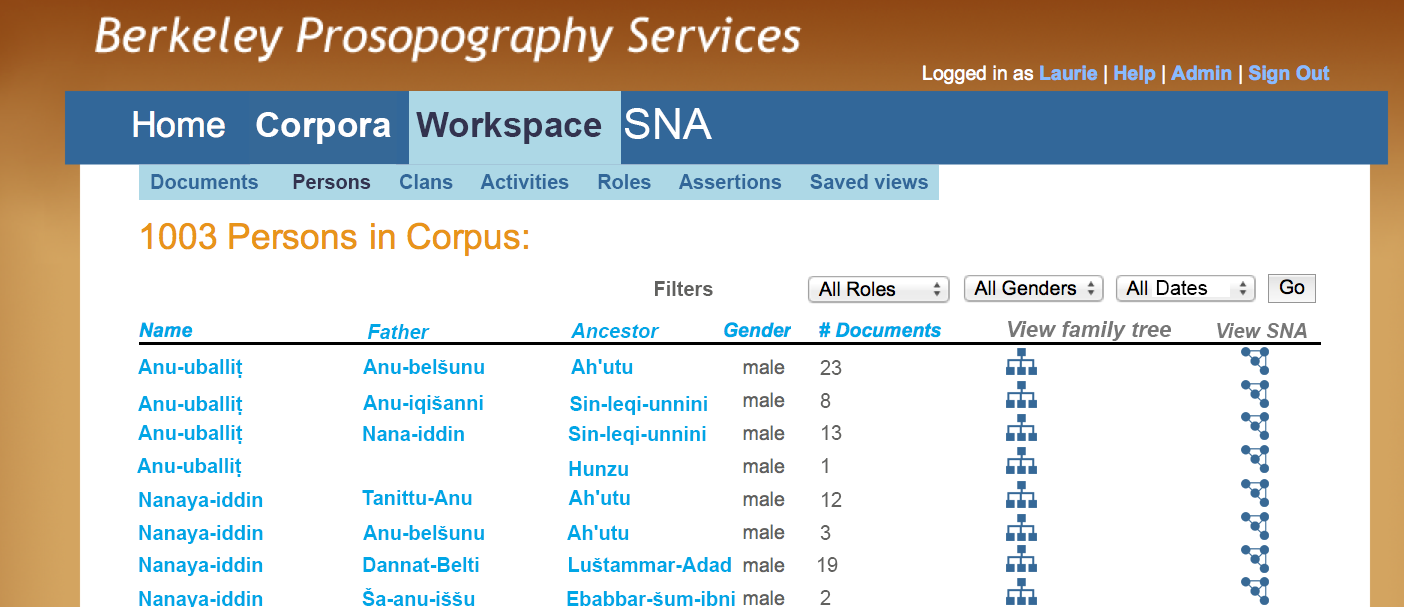
Figure J - SNA: List of Disambiguated Persons
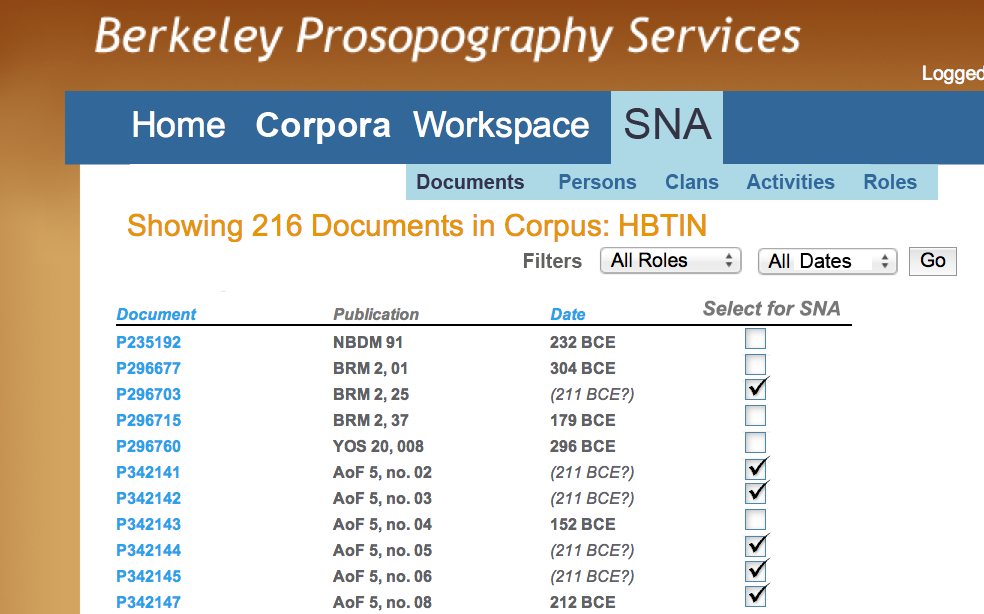
Figure K - SNA: Selecting Documents
Figures K, L, and M show some of the user interface that will support investigation of Social Networks. The user can set up social network graph visualizations by selecting those texts (Figure K), the kinds of activities (Figure L), and specific individuals (Figure M), to include in the graph visualization. These planned extensions of BPS visualizations will provide the researcher with a highly customizable and response interface producing valuable tools for assessment and diagrams for publication in digital or traditional print venues.
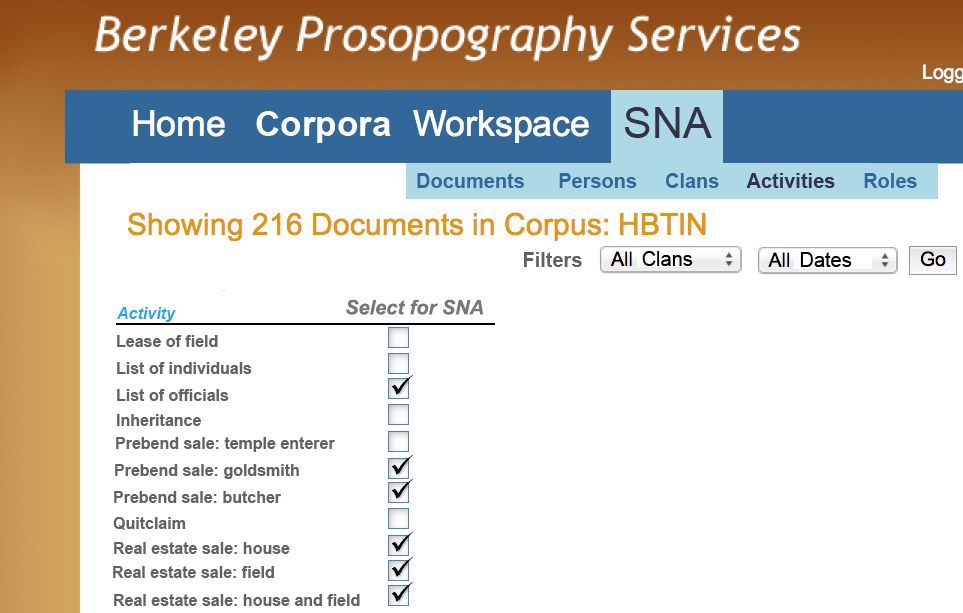
Figure L - SNA: Selecting Activities
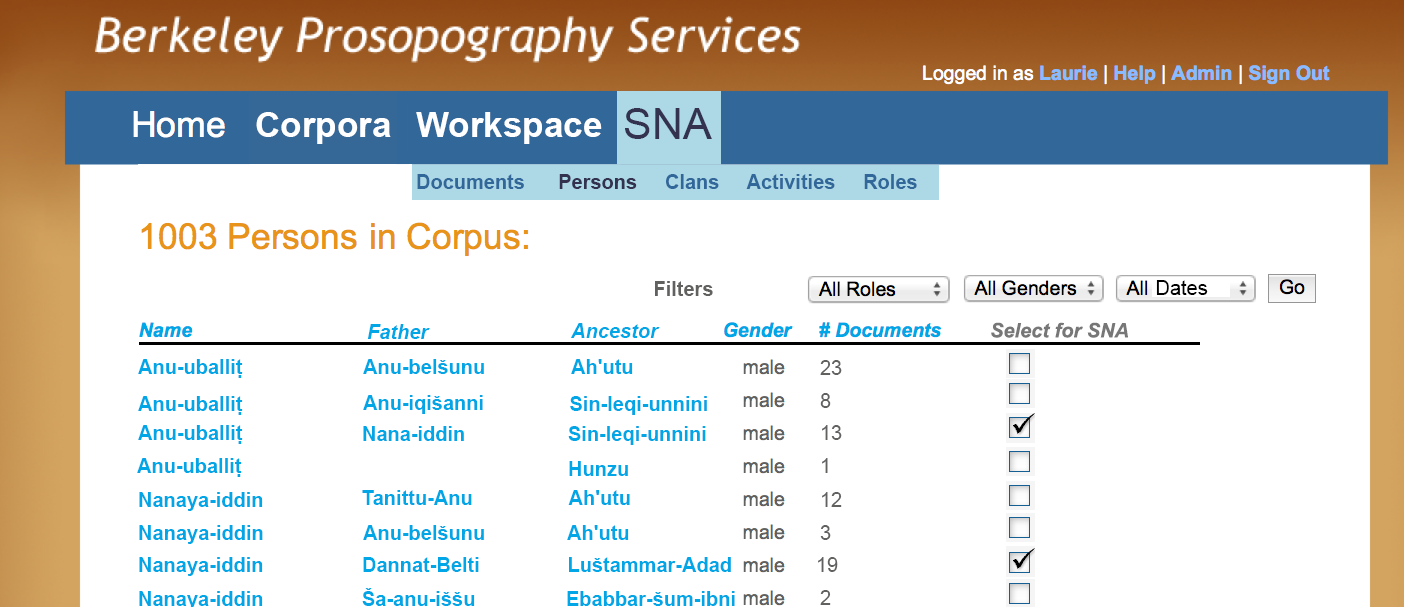
Figure M - SNA: Selecting Individuals
The Social Network Graphs
SNA graphs demonstrate the connections between individuals (nodes, represented as colored dots) throughout the corpus. The lines (arcs) that link them represent the activity through which they are connected. The BPS visualizer produces interactive graphs that can represent a social network through a variety of views, allowing the user to explore the individuals and relationships as fully as possible. The following graphs present visualizations of prosopographical data in another subset of the Uruk text corpus, the family headed by Nanâ-iddin (Doty 1978).
A Family Tree (Figure N) depicts a network of individuals linked through sanguineous (blood) and affinal (marriage) lines. In BPS, this traditional and still useful genealogical tool is made interactive, as branches of the family tree may be expanded or collapse according to the user’s research interest.
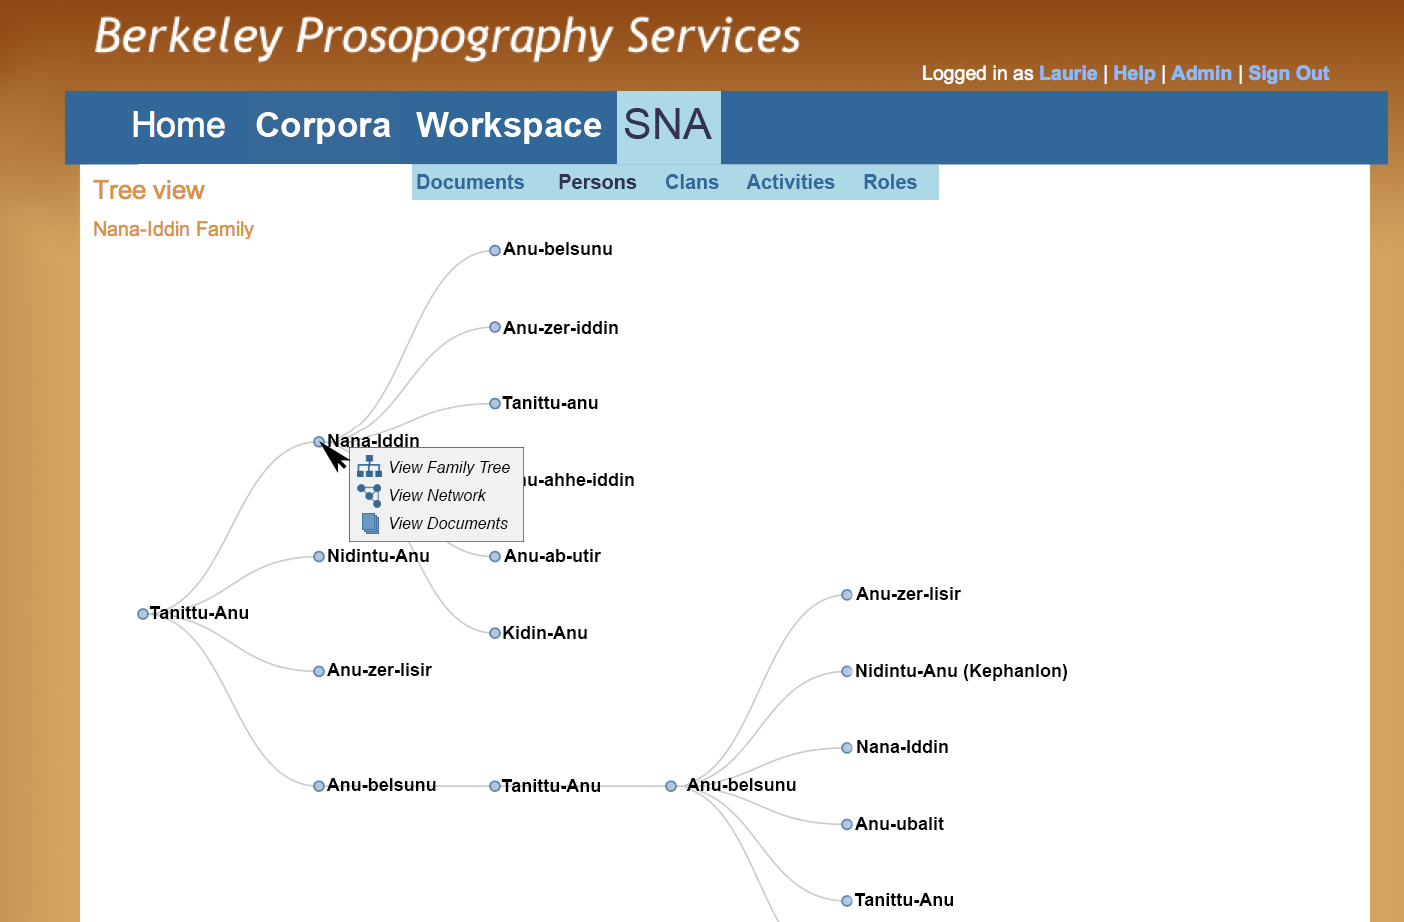
Figure N - Family Tree
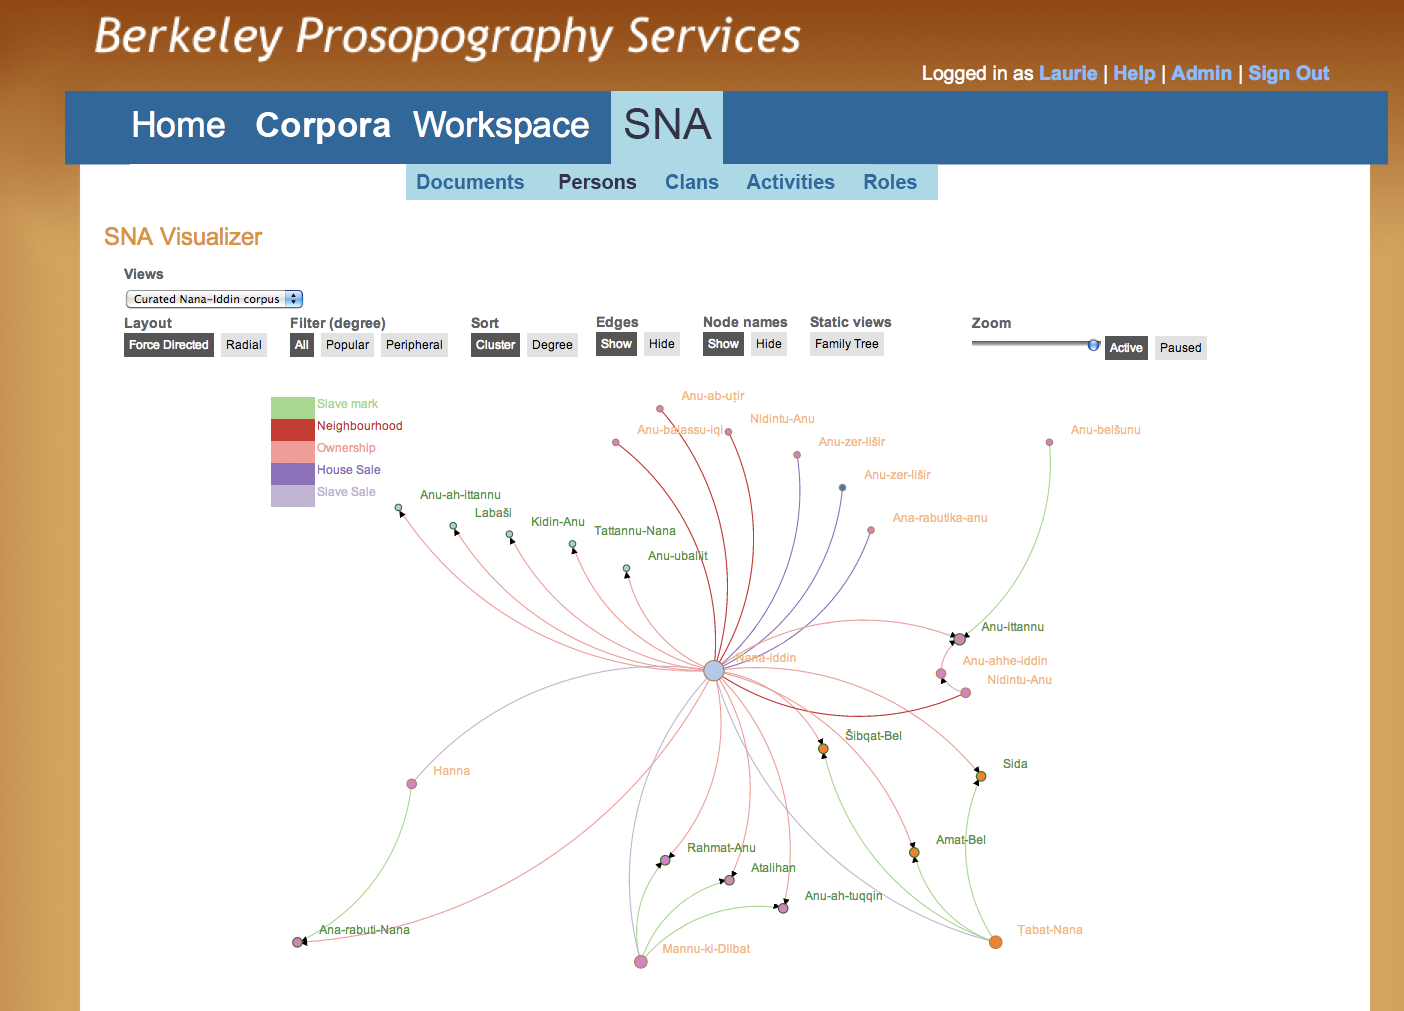
Figure O - Network Visualization, Single Individual
The graph in Figure O is centered on Nana-iddin, represented by the largest node on the graph, and reflects the social network metric of degree (how many connections exist between this person and others). The color-coded arcs represent the activity that connects each pair of individuals and the arrows reflect the direction of the relationship in those activities (e.g., from seller to buyer). The graph is interactive: the user can zoom in on the graph to enlarge it and can rearrange nodes on the screen to facilitate investigation of groups that initially appear in tightly packed configurations. Double-clicking on a node “snaps off” a sub-section of the graph, providing the user a close-up view of the network centered around the selected individual. This is particularly useful in a densely populated graph, such as in Figure P.
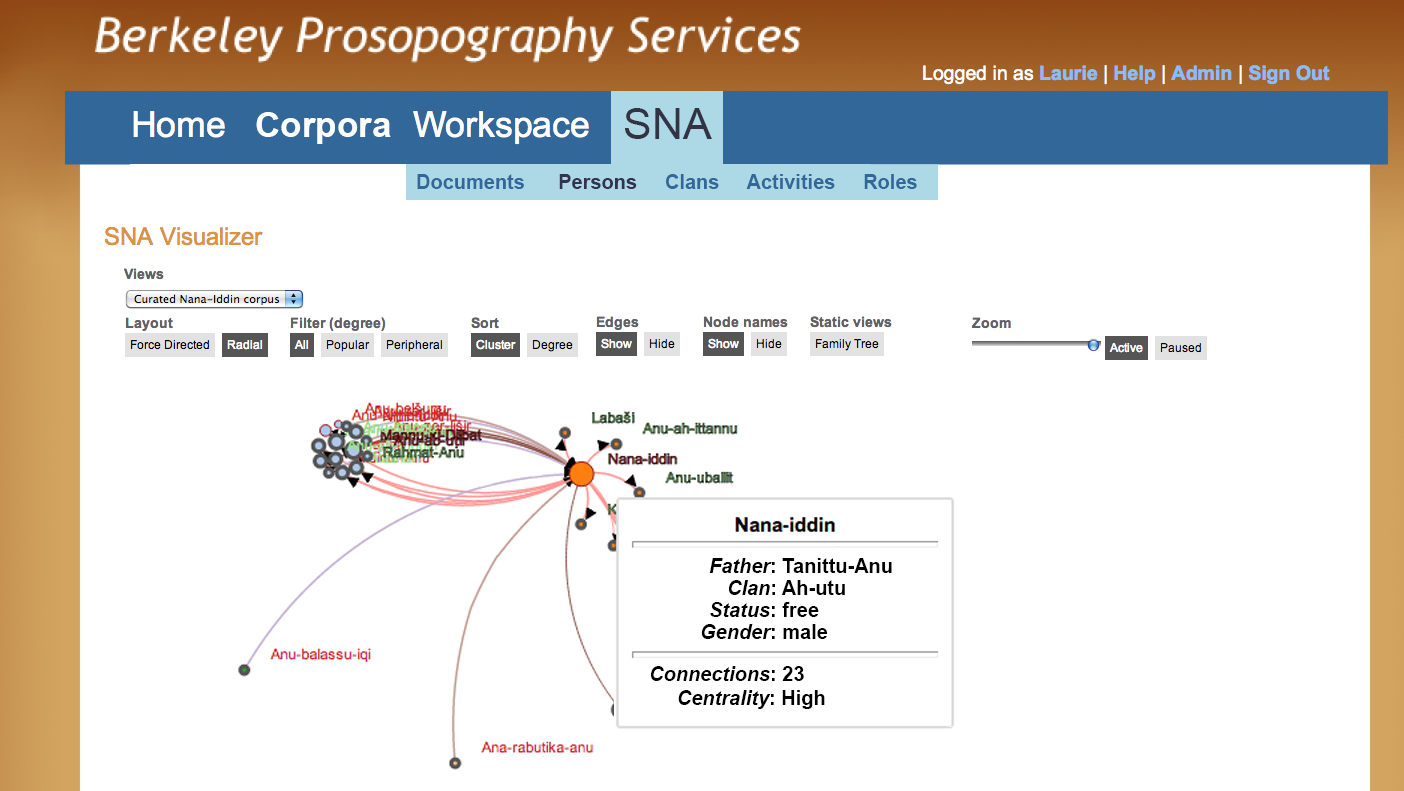
Figure P - Radial View
The graph in Figure P offers a different view of (much of) the same information as in Figure O. The same individuals remain distributed around the central figure, but now appear in clusters reflecting sub-groups of connected individuals. The call-out box that appears when the user hovers the mouse over the node for an individual provides additional information about the individual (status, gender, family connections); below the ruling, the metrics used to compute the social network appear. Most humanities researchers are more interested in the diagram than in the means by which it was produced, but these statistics may be of interest to the more experienced prosopographer.
Conclusion
Lists of names and SNA visualizations are not ends in themselves. Whether generated by hand, as Pearce and Doty did, or automatically by BPS, as outlined in this user narrative, they are tools and products of intellectual inquiry that reflect and support investigation. In an accessible interface that facilitates researchers’ interactions, the natural processes inherent in working with prosopographical data are replicated and applied to mathematical models (which many humanities scholars might avoid) which support visualizations that invite further and more in-depth exploration of research questions.